Most of the work behind Polmanarkivet is visible only through its outputs: published articles, a book, or the website itself. However, the research behind those outputs is harder to see. It is spread across hundreds of records gathered over nearly five years; and, until recently, I could only look at it one record at a time.
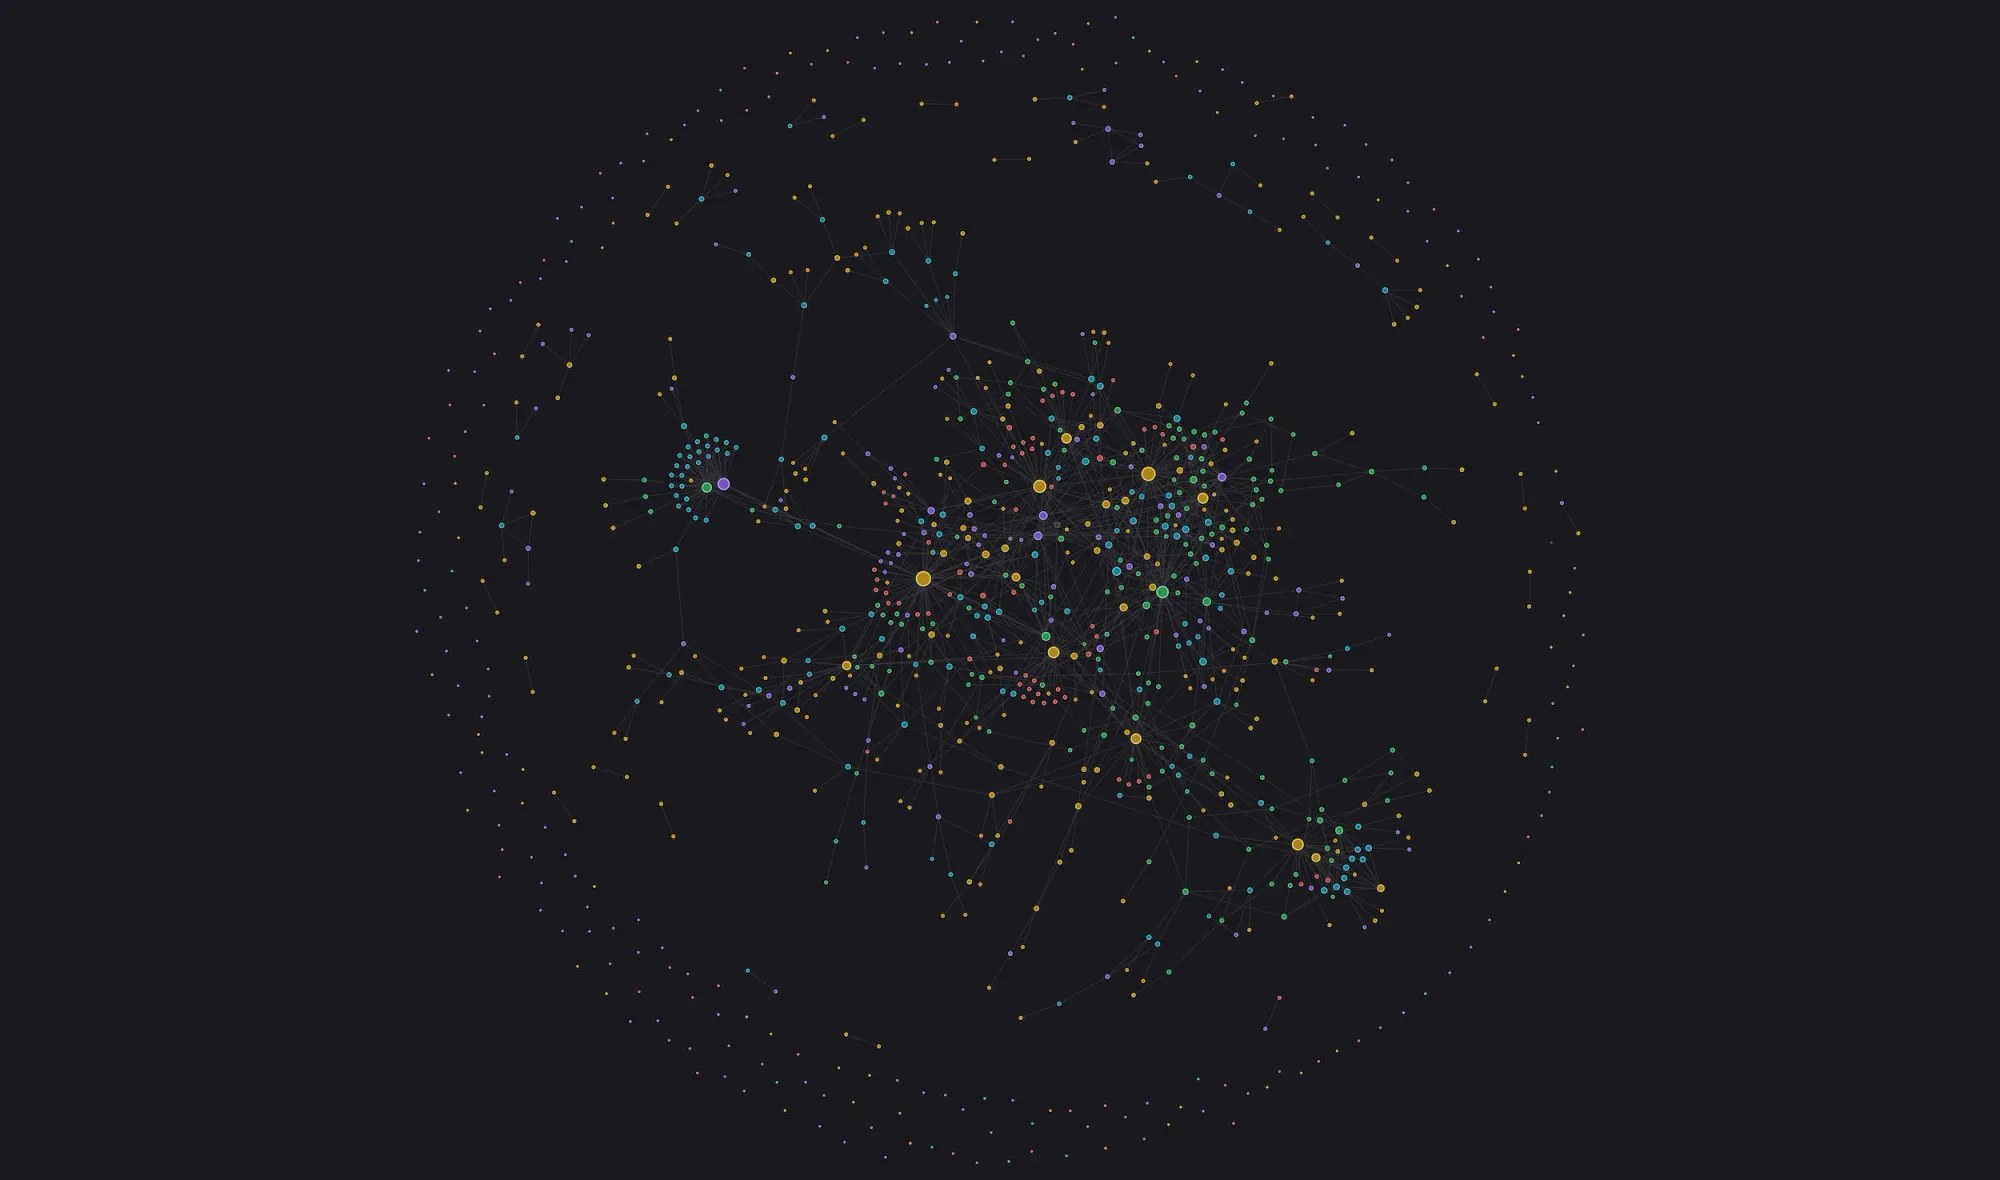
For the past year, the research has been kept in Capacities, a note-taking app that lets you create your own object types. Each person, place, event, object and source is stored as a separate record, and records can be linked to one another. Capacities recently added a global graph, a view that shows every record as a node and every link as a line in a single view. Records with many links pull together, and records with few or none drift to the edges.
The graph of the Polman, Påhlman, and von Pohlmann research currently holds 184 people, 85 places, 131 items (objects and documents such as portraits, letters and manuscripts), 103 events and 189 sources (published works). Each object type has its own colour to make them easier to see on the graph: people = yellow, places = green, events = red, items = teal, and sources = purple.
My first impression after seeing the global graph was of a night sky: scattered points, with a few dense clusters that seemed to have their own gravity. Because of the colours, I could tell at a glance which clusters centred on people and which on places. What struck me most was that I was looking at the research effort itself in one place for the first time.
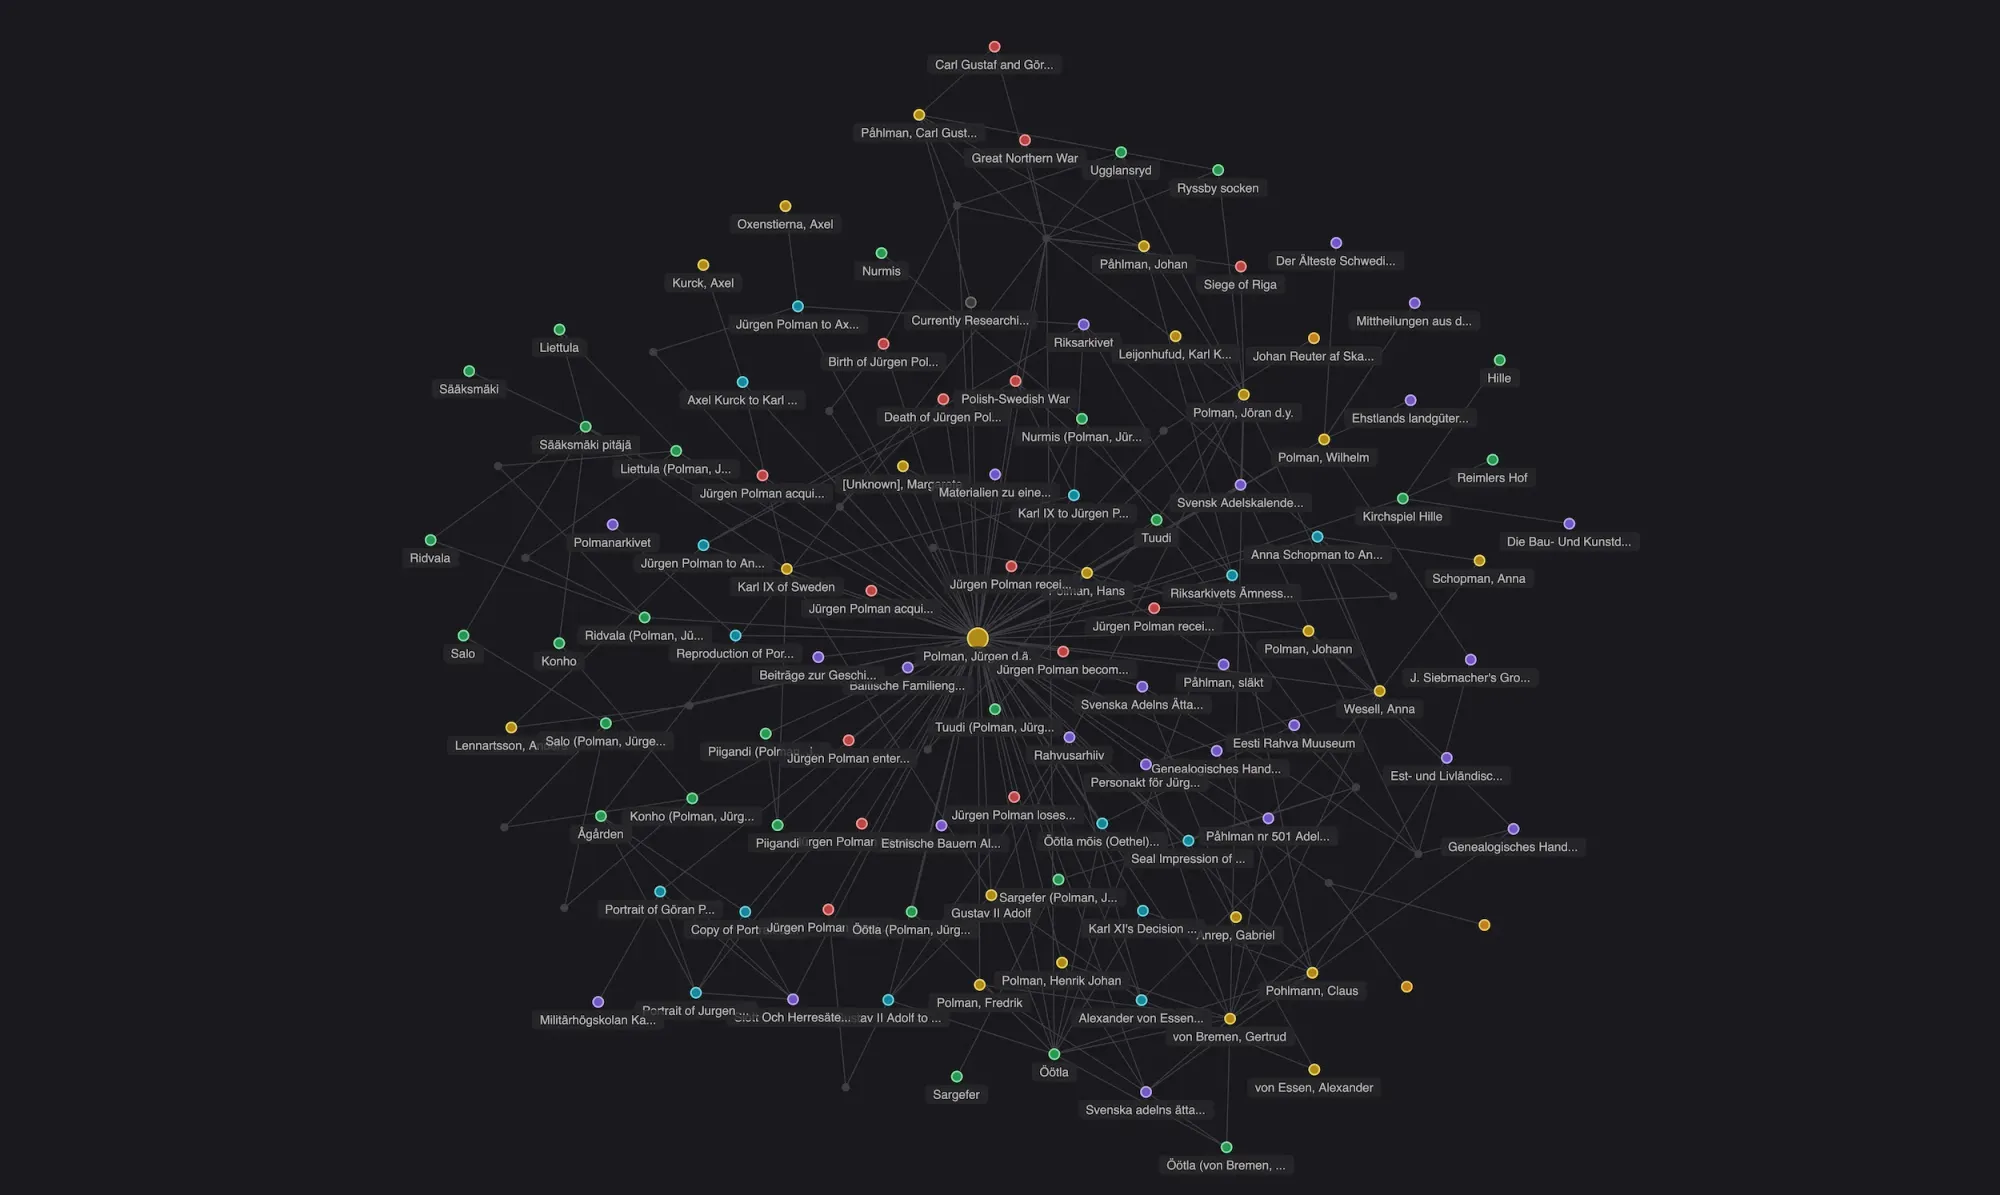
The centre
The largest node in the graph is Jürgen Polman the Elder (c. 1567–c. 1633), the patriarch of both the Swedish Påhlman branch and the Estonian von Pohlmann branch.
Polmanarkivet is sustained by its Stewards
We have made this article free because we believe our family history belongs to everyone. If you value this work, please consider becoming a Steward of the Archive. Your annual contribution ensures these stories are never lost again.
Become a Steward